Institutional Insights: Goldman Sachs SP500 Positioning & Key Levels 19/8/25

Here's a summary of the consolidated recap regarding GS positioning metrics:
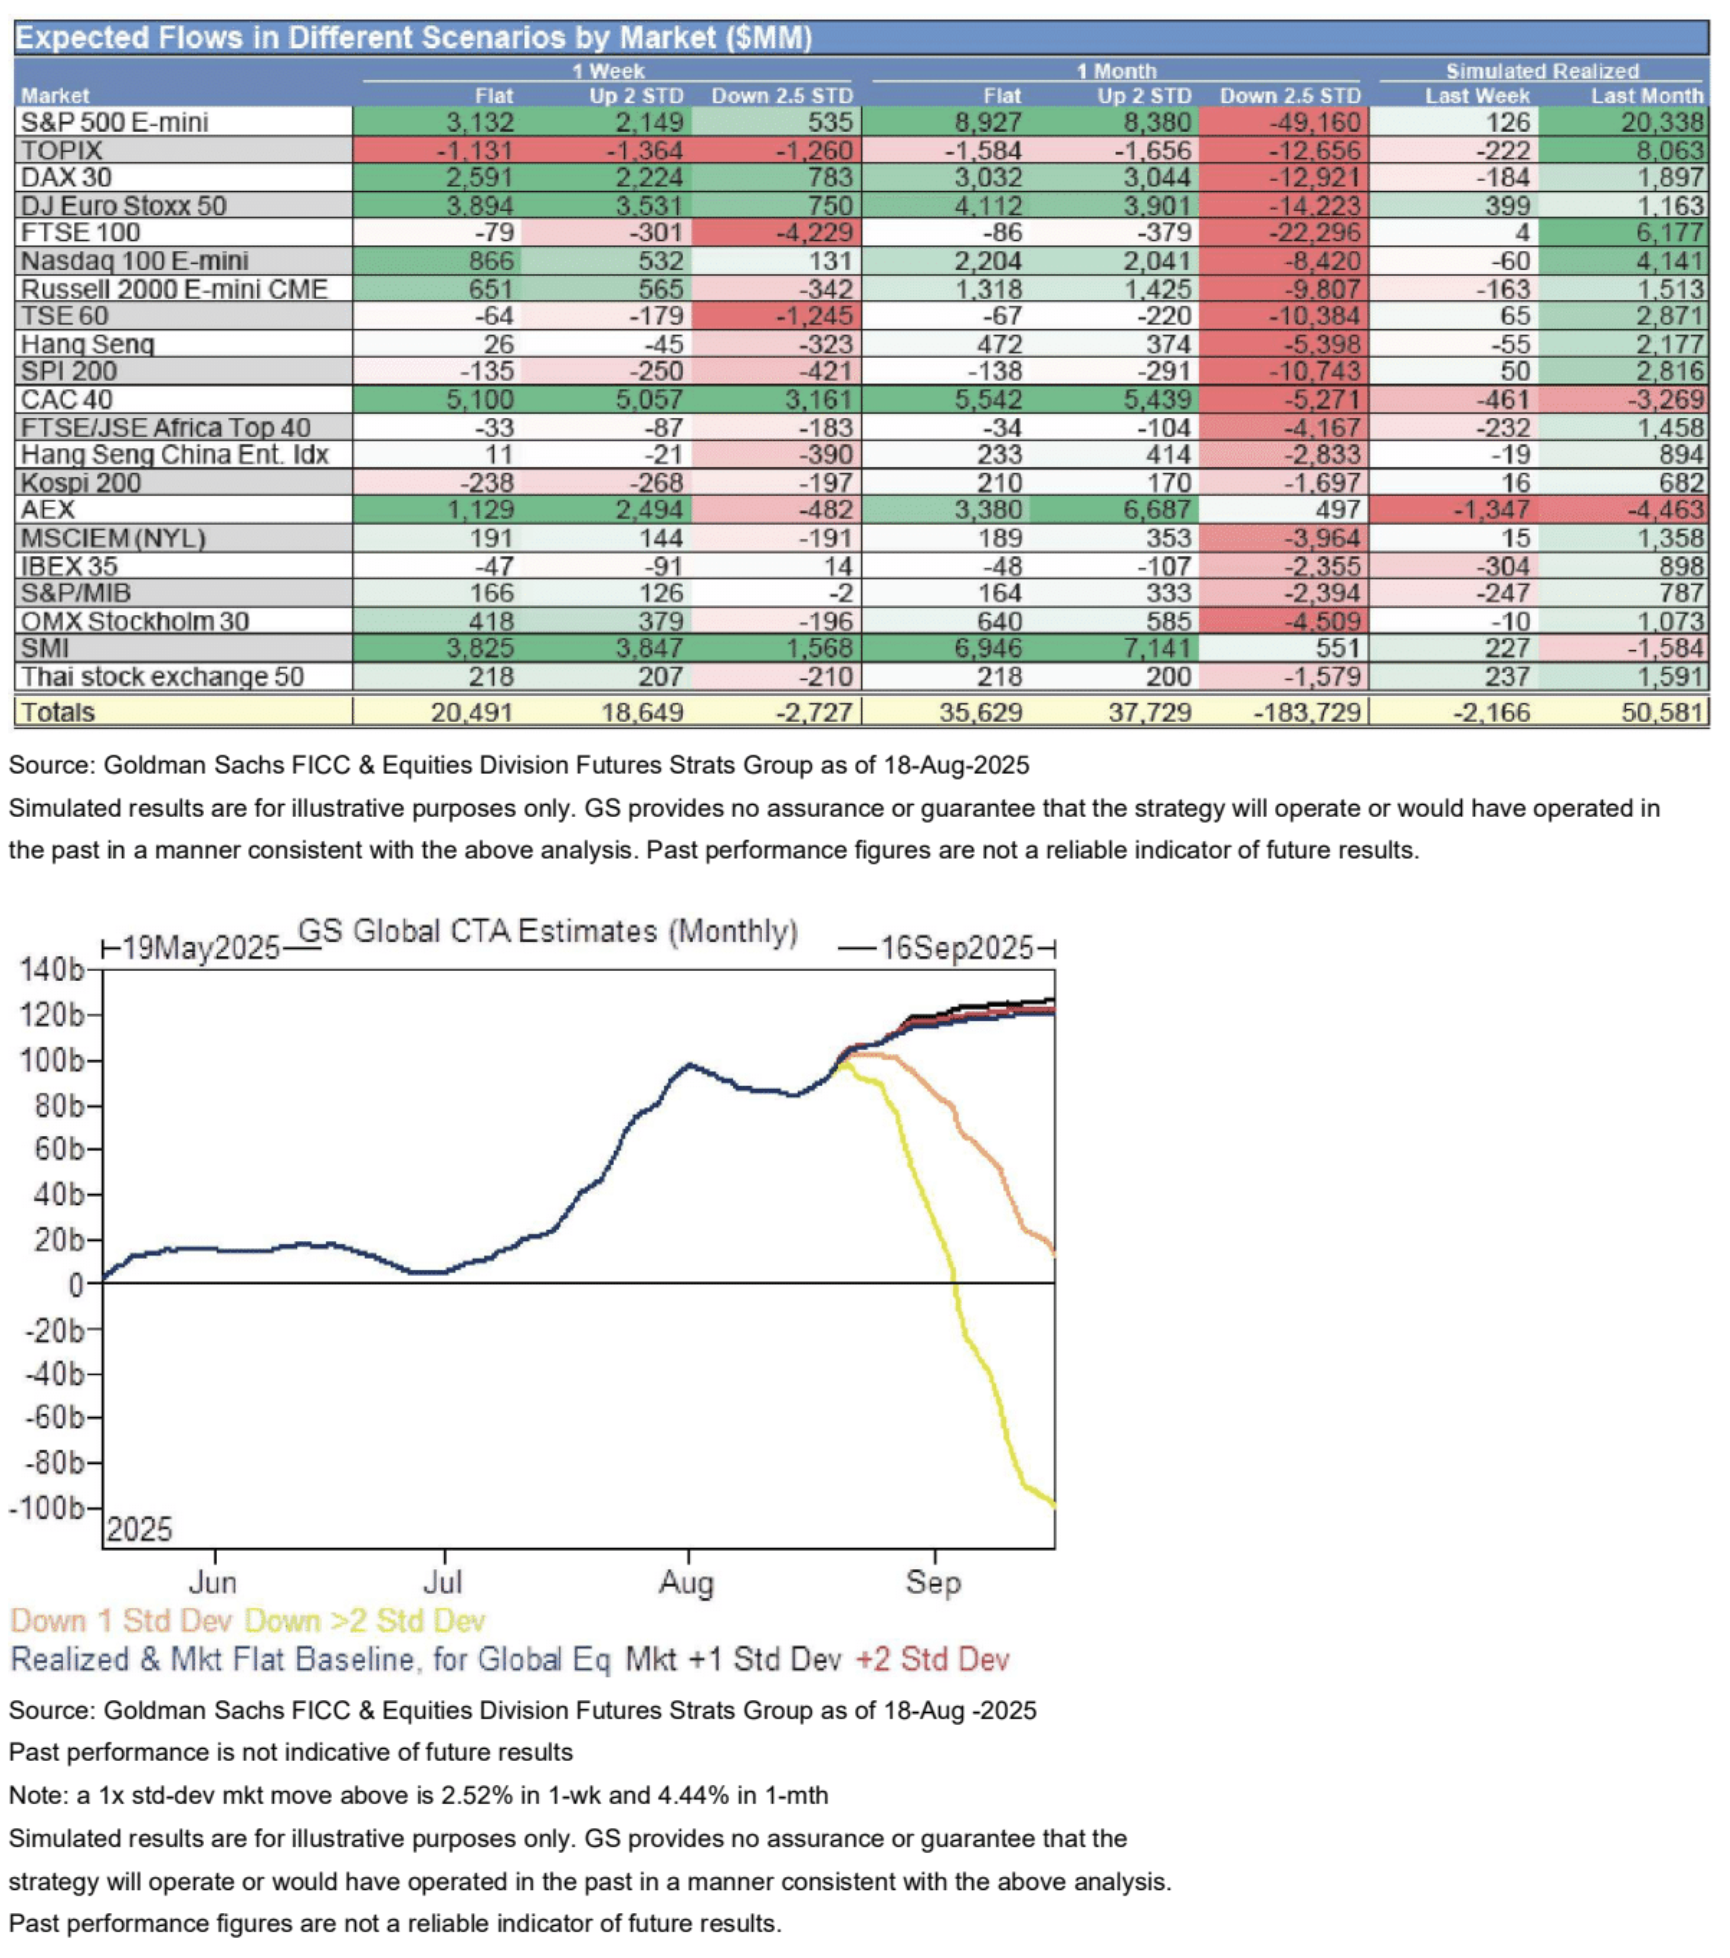
CTA Corner: The current baseline for equities indicates some minor continued net buying, but, in contrast to bonds, the conditional equity flow from this group leans more towards selling than buying at present (Paul Leyzerovich / link).
GS PB: The GS Equity Fundamental Long/Short Performance Estimate increased by +1.05% from 8/8 to 8/14 (compared to MSCI World TR +1.89%), largely due to a beta of +0.91% and an alpha of +0.14%, benefiting from long side profits. Meanwhile, the GS Equity Systematic Long/Short Performance Estimate also rose for the third consecutive week by +0.32% during the same timeframe, due to an alpha of +0.24% from long side profits and a beta of +0.07% (link).
Buybacks: We are currently in the midst of the latest open window period, with an estimated ~90% of the S&P 500 in an open window, expected to reach ~92% by the end of the week (link).
Charts in Focus: Key indicators include the Sentiment Indicator, US Panic Index, Risk Appetite Indicator, SPX vs. Singles Skew, Call Skew vs. Put Skew, S&P Futures Liquidity, and Funding Spreads vs. S&P 500.
CTA Corner - CTA Flows:
For the coming week:
Flat tape: Buyers at $20.49B ($4.65B in the US)
Up tape: Buyers at $18.65B ($3.25B in the US)
Down tape: Sellers at $2.73B ($0.32B in the US)
For the next month:
Flat tape: Buyers at $35.63B ($12.45B in the US)
Up tape: Buyers at $37.73B ($11.85B in the US)
Down tape: Sellers at $183.73B ($67.39B out of the US)
Key Pivot Levels for SPX:
Short-term: 6270
Medium-term: 6045
Long-term: 5738
Disclaimer: The material provided is for information purposes only and should not be considered as investment advice. The views, information, or opinions expressed in the text belong solely to the author, and not to the author’s employer, organization, committee or other group or individual or company.
Past performance is not indicative of future results.
High Risk Warning: CFDs are complex instruments and come with a high risk of losing money rapidly due to leverage. 69% and 73% of retail investor accounts lose money when trading CFDs with Tickmill UK Ltd and Tickmill Europe Ltd respectively. You should consider whether you understand how CFDs work and whether you can afford to take the high risk of losing your money.
Futures and Options: Trading futures and options on margin carries a high degree of risk and may result in losses exceeding your initial investment. These products are not suitable for all investors. Ensure you fully understand the risks and take appropriate care to manage your risk.
Patrick has been involved in the financial markets for well over a decade as a self-educated professional trader and money manager. Flitting between the roles of market commentator, analyst and mentor, Patrick has improved the technical skills and psychological stance of literally hundreds of traders – coaching them to become savvy market operators!